Accurate event correlation across enterprise infrastructure requires consistent clock synchronization. During a security incident or network fault, conflicting device timestamps hinder root-cause analysis and incident response.
Network Time Protocol (NTP) provides time synchronization across network nodes, while Syslog forwards system messages to a central server with millisecond-accurate timestamps for consolidated monitoring.
Lab Objective: Synchronize Cisco ISR router and Catalyst switch to a central NTP server, configure logging timestamps, and stream system events to a central Syslog collector over standard UDP port 514.
📁 Lab File: Download the Centralized NTP and Syslog Packet Tracer Lab (.pkt).
Topology
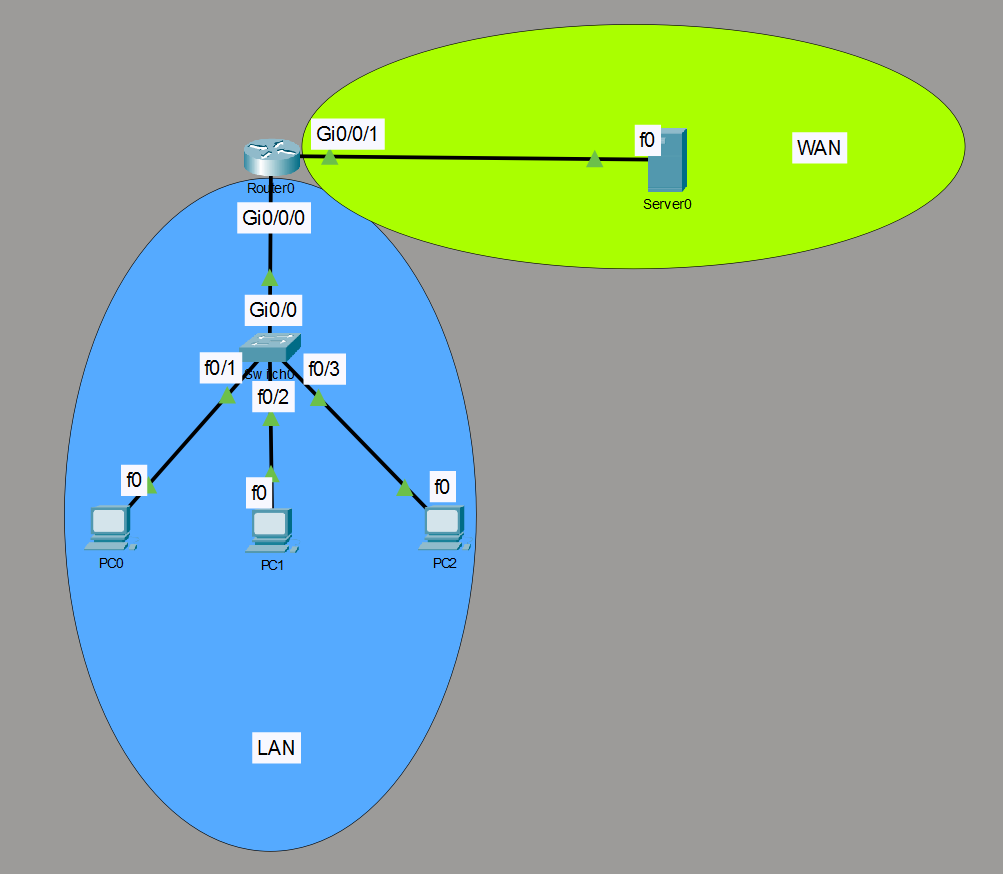
The edge router (Router0) connects internal LAN management traffic (192.168.10.0/24) to an external management segment (203.0.113.0/24). A central server (Server0) hosts both NTP and Syslog services. Switch0 connects to Router0 via interface Gi0/0/0.
| Device | Interface | Role | IP Address | Subnet Mask | Default Gateway |
|---|---|---|---|---|---|
| Router0 | Gi0/0/0 | LAN Gateway | 192.168.10.1 | 255.255.255.0 | N/A |
| Router0 | Gi0/0/1 | WAN / Mgmt Gateway | 203.0.113.1 | 255.255.255.0 | N/A |
| Switch0 | VLAN 1 | Switch Management | 192.168.10.2 | 255.255.255.0 | 192.168.10.1 |
| Server0 | Fa0 | NTP & Syslog Server | 203.0.113.2 | 255.255.255.0 | 203.0.113.1 |
Device Configurations
Configure interfaces, establish NTP synchronization to Server0, set local time zones, and enable centralized Syslog logging on all managed devices.
Server0
Open Server0, navigate to the Services tab, and configure the following:
Network Time Protocol (NTP) Service
- Go to Services > NTP.
- NTP: Set radio button to On.
- Date & Time: Set the current date and time.
- Authentication: Set to Disable (unless configuring NTP authentication keys on your routers).
Centralized Logging (Syslog) Service
- Go to Services > SYSLOG.
- Syslog: Set radio button to On.
- Note: Once
Router0andSwitch0send logging messages, the messages will dynamically populate in the Syslog event table on this screen.
IP Configuration (FastEthernet0)
Navigate to Desktop > IP Configuration and assign static parameters:
- IP Address: 203.0.113.2
- Subnet Mask: 255.255.255.0
- Default Gateway: 203.0.113.1
Router0 (Edge Gateway)
enable
configure terminal
hostname Router0

! --- 1. Interface Setup ---
interface GigabitEthernet0/0/0
 description Internal LAN Gateway
 ip address 192.168.10.1 255.255.255.0
 no shutdown
exit

interface GigabitEthernet0/0/1
 description External WAN / Server Segment
 ip address 203.0.113.1 255.255.255.0
 no shutdown
exit

! --- 2. NTP & Time Zone Configuration ---
clock timezone EST -5
ntp server 203.0.113.2

! --- 3. Syslog & Timestamp Setup ---
logging on
service timestamps log datetime msec
service timestamps debug datetime msec
logging host 203.0.113.2
logging trap debugging
exit
write memory
Switch0 (Access Switch)
enable
configure terminal
hostname Switch0

! --- 1. Management IP Configuration ---
interface Vlan1
 description Management Interface
 ip address 192.168.10.2 255.255.255.0
 no shutdown
exit

ip default-gateway 192.168.10.1

! --- 2. NTP & Syslog Setup ---
clock timezone EST -5
ntp server 203.0.113.2
logging on
service timestamps log datetime msec
service timestamps debug datetime msec
logging host 203.0.113.2
logging trap debugging
exit
write memory
Verification
Verify clock synchronization, check NTP peer associations, inspect logging settings, and confirm remote Syslog log receipt.
Troubleshooting Note (Packet Tracer Bug): In Packet Tracer, ISR router images (such as the 4331) often encounter a simulator limitation where the NTP daemon remains stuck in
stratum 16 (.INIT.)because thentp sourcecommand is omitted from the IOS feature subset. The Catalyst switch SVI processes NTP reliably. For this reason, we verifyshow ntp statuson Switch0 and verify Syslog generation on Router0. Fast-forward time several times to establish initial stratum lock.
| Step | Test | Command / Action | Expected Result |
|---|---|---|---|
| 1 | Verify Time Sync | show ntp status (Switch0) | Output shows Clock is synchronized, stratum 2. |
| 2 | Check Association | show ntp associations (Switch0) | Displays 203.0.113.2 with an asterisk (*) indicating the configured reference clock. |
| 3 | Verify Logging Config | show logging (Router0) | Confirms logging is enabled, timestamping uses datetime msec, and 203.0.113.2 is configured as a logging host. |
| 4 | Generate Test Event | interface Gi0/0/0 shutdown | A local CLI syslog message appears. |
| 5 | Check Remote Collector | Access Server0 > Services > Syslog | The interface shutdown log message appears in the central Syslog server display. |
Step 1: Verify Time Sync (show ntp status)
Execute show ntp status on Switch0 to confirm clock synchronization to the server:
Switch0# show ntp status
Clock is synchronized, stratum 2, reference is 203.0.113.2
nominal freq is 250.0000 Hz, actual freq is 249.9990 Hz, precision is 2**24
reference time is E084B201.000001A4 (10:15:22.420 EST Tue Sep 15 2026)
clock offset is 1.00 msec, root delay is 14.00 msec
Step 2: Check Association (show ntp associations)
Inspect the NTP peer table to verify that 203.0.113.2 is selected as the system peer:
Switch0# show ntp associations
address              ref clock       st   when  poll reach  delay  offset   disp
*~203.0.113.2        127.127.1.1     1    12    64   377    14.00  1.00     0.25
 * sys.peer, # selected, + candidate, - outlyer, x falseticker, ~ configured
Step 3: Verify Logging (show logging)
Confirm that logging is active, timestamping is enabled, and the Syslog host server is set:
Router0# show logging
Syslog logging: enabled (0 messages dropped, 0 messages rate-limited,
    0 flushes, 0 overruns, xml disabled, filtering disabled)

No Active Message Discriminator.

No Inactive Message Discriminator.

    Console logging: level debugging, 5 messages logged, xml disabled,
        filtering disabled
    Monitor logging: level debugging, 5 messages logged, xml disabled,
        filtering disabled
    Buffer logging: level debugging, 0 messages logged, xml disabled,
        filtering disabled

    Logging Exception size (4096 bytes)
    Count and timestamp logging messages: disabled
    Persistent logging: disabled

No active filter modules.

ESM: 0 messages dropped
    Trap logging: level debugging, 5 message lines logged
        Logging to 203.0.113.2  (udp port 514, audit disabled,
            authentication disabled, encryption disabled, link up),
            3 message lines logged,
            0 message lines rate-limited,
            0 message lines dropped-by-MD,
            xml disabled, sequence number disabled
            filtering disabled

Log Buffer (4096 bytes):

%LINEPROTO-5-UPDOWN: Line protocol on Interface GigabitEthernet0/0/0, changed state to up
%LINEPROTO-5-UPDOWN: Line protocol on Interface GigabitEthernet0/0/0, changed state to up
Step 4: Generate Log (interface Gi0/0/0 -> shutdown)
Administrative state changes trigger an immediate Syslog alert with timestamps:
Router0(config)# interface GigabitEthernet0/0/0
Router0(config-if)# shutdown
*Sep 15 10:16:04.112 EST: %LINK-5-CHANGED: Interface GigabitEthernet0/0/0, changed state to administratively down
*Sep 15 10:16:05.112 EST: %LINEPROTO-5-UPDOWN: Line protocol on Interface GigabitEthernet0/0/0, changed state to down
Step 5: Remote Check (View Server0 Syslog Tab)
Open Server0 > Services > Syslog in Packet Tracer to confirm the event arrived at the central server with the synchronized time:
Time                    IP Address      Message
Sep 15 10:16:04.112 EST 192.168.10.1    %LINK-5-CHANGED: Interface GigabitEthernet0/0/0, changed state to administratively down
Sep 15 10:16:05.112 EST 192.168.10.1    %LINEPROTO-5-UPDOWN: Line protocol on Interface GigabitEthernet0/0/0, changed state to down